Entry by Claudia Avila

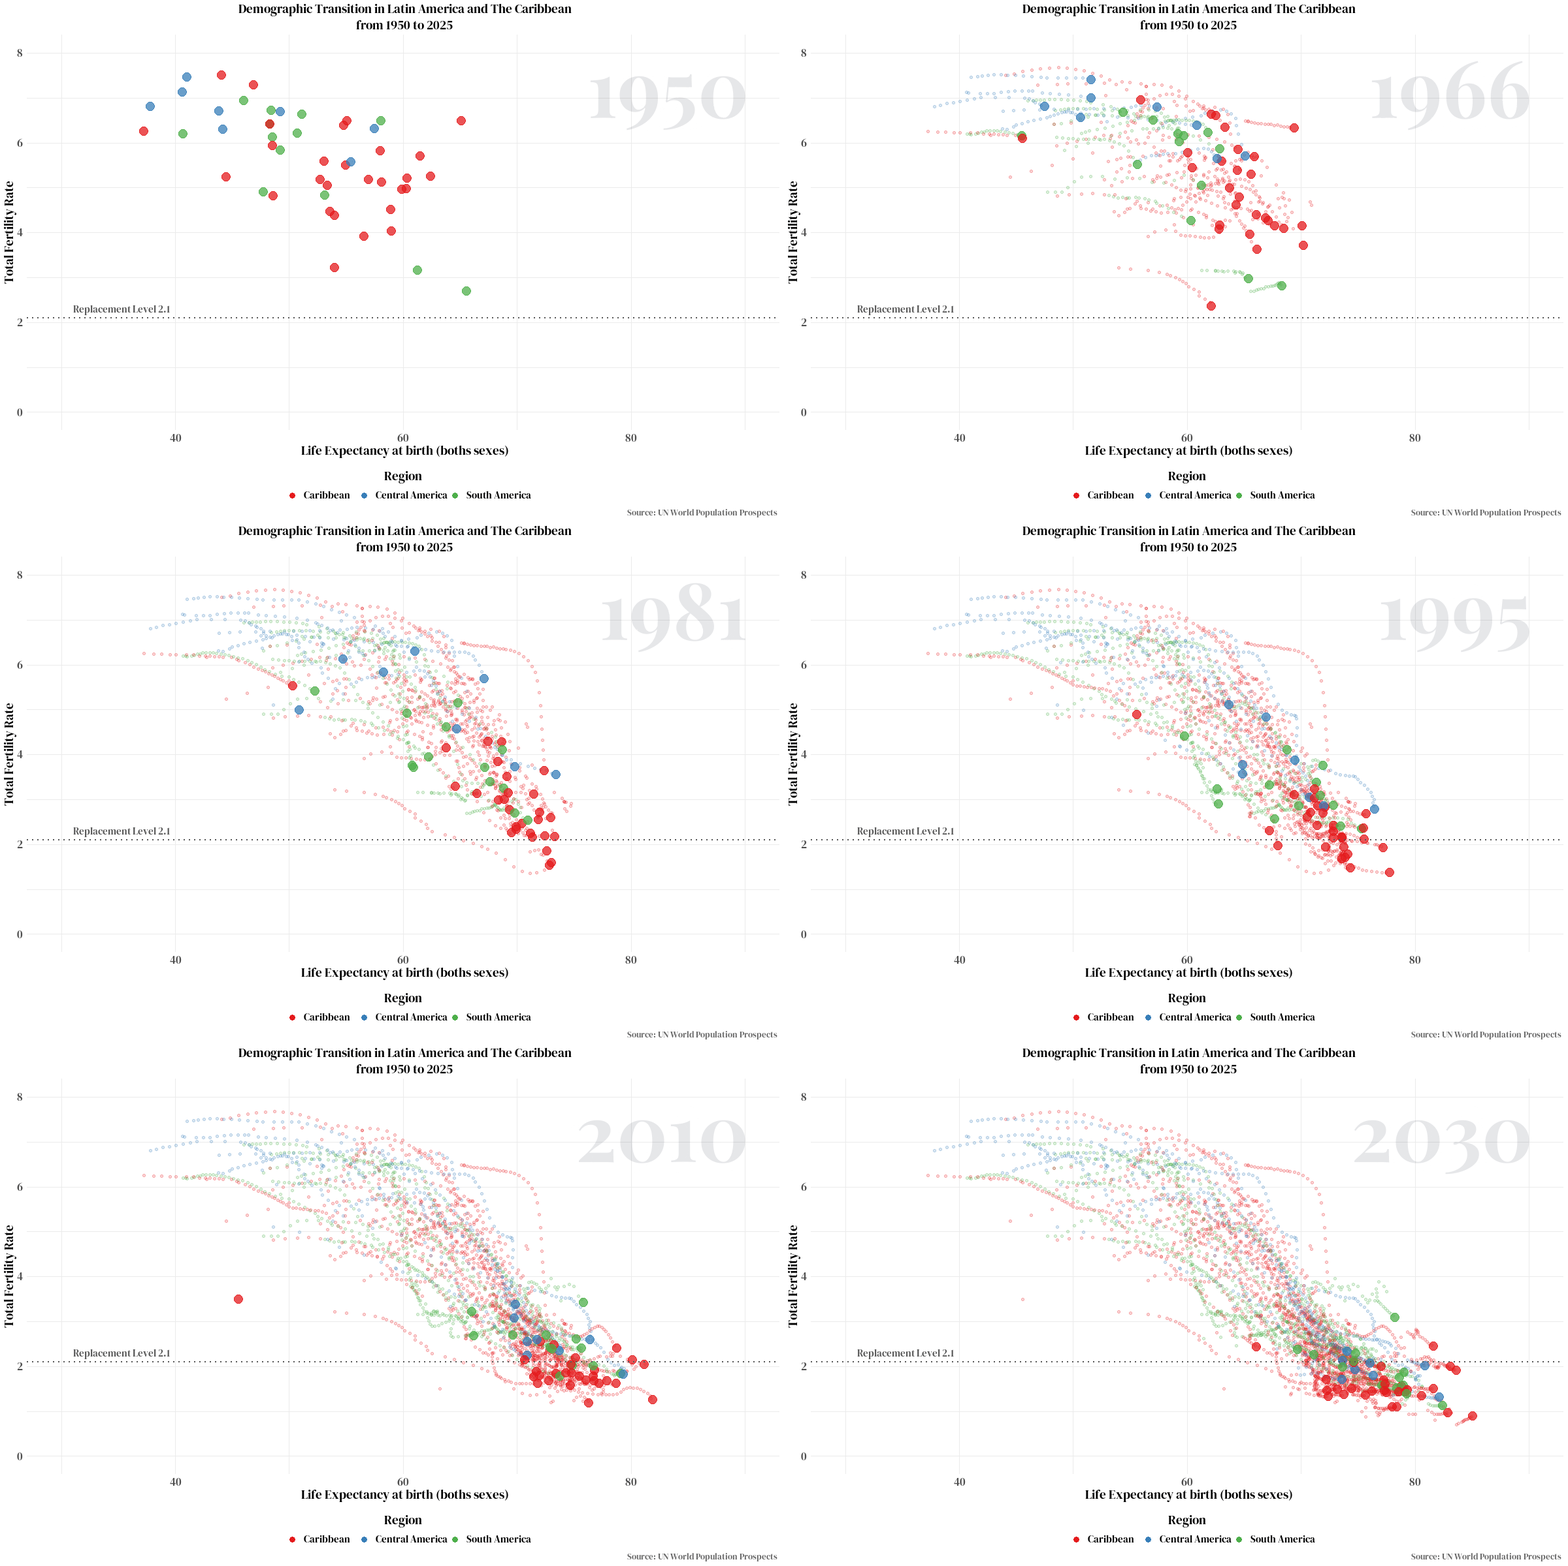
This animated scatterplot documents the demographic transition of Latin America and the Caribbean from 1950 to 2025, using data from the UN World Population Prospects 2024. The visualization tracks two fundamental demographic indicators—life expectancy and total fertility rate—for countries with populations over 100,000 in 2025.
The plot enables a detailed examination of population changes across different sub-regions. By representing each country as a moving point, the animation reveals how life expectancy and fertility rates have evolved over 75 years. Color distinctions highlight the diverse trajectories of Caribbean, Central American, and South American nations.
A horizontal line at 2.1 fertility represents the replacement level, providing a critical reference point for understanding population dynamics. The visualization’s design allows viewers to perceive the pace of demographic change: rapid shifts appear as long jumps between data points, while gradual transitions show shorter movements.
Different regions exhibit distinct patterns of demographic transition. Central America shows compressed fertility declines, with population rates changing dramatically in short periods. The Southern Cone reached sub-replacement fertility earlier, while the Caribbean demonstrates more varied demographic paths, including periods of stagnation and unexpected reversals.
The animation also captures significant demographic disruptions. The 2010 Haitian earthquake is visible as a sudden leftward movement, illustrating how catastrophic events can immediately impact population dynamics. Similarly, the COVID-19 pandemic’s global effect is represented through synchronized reductions in life expectancy across multiple countries in 2020.
This visualization represents the first step in my doctoral research, exploring demographic transition in Latin America and the Caribbean through the lens of the pace of change. By making the pace of population changes visible, it offers a different perspective on understanding regional demographic dynamics.
