
Regional ocean model configuration with accurate representation of the Tasman Sea internal wave beam
This is a figure from a submitted paper showing my high resolution regional ocean model used for studying internal waves in the Tasman Sea. Now, the other figures in the paper actually show scientific results, but internal waves are notoriously hard to visualise nicely, and I don’t think the other technical figures are nearly as pretty.
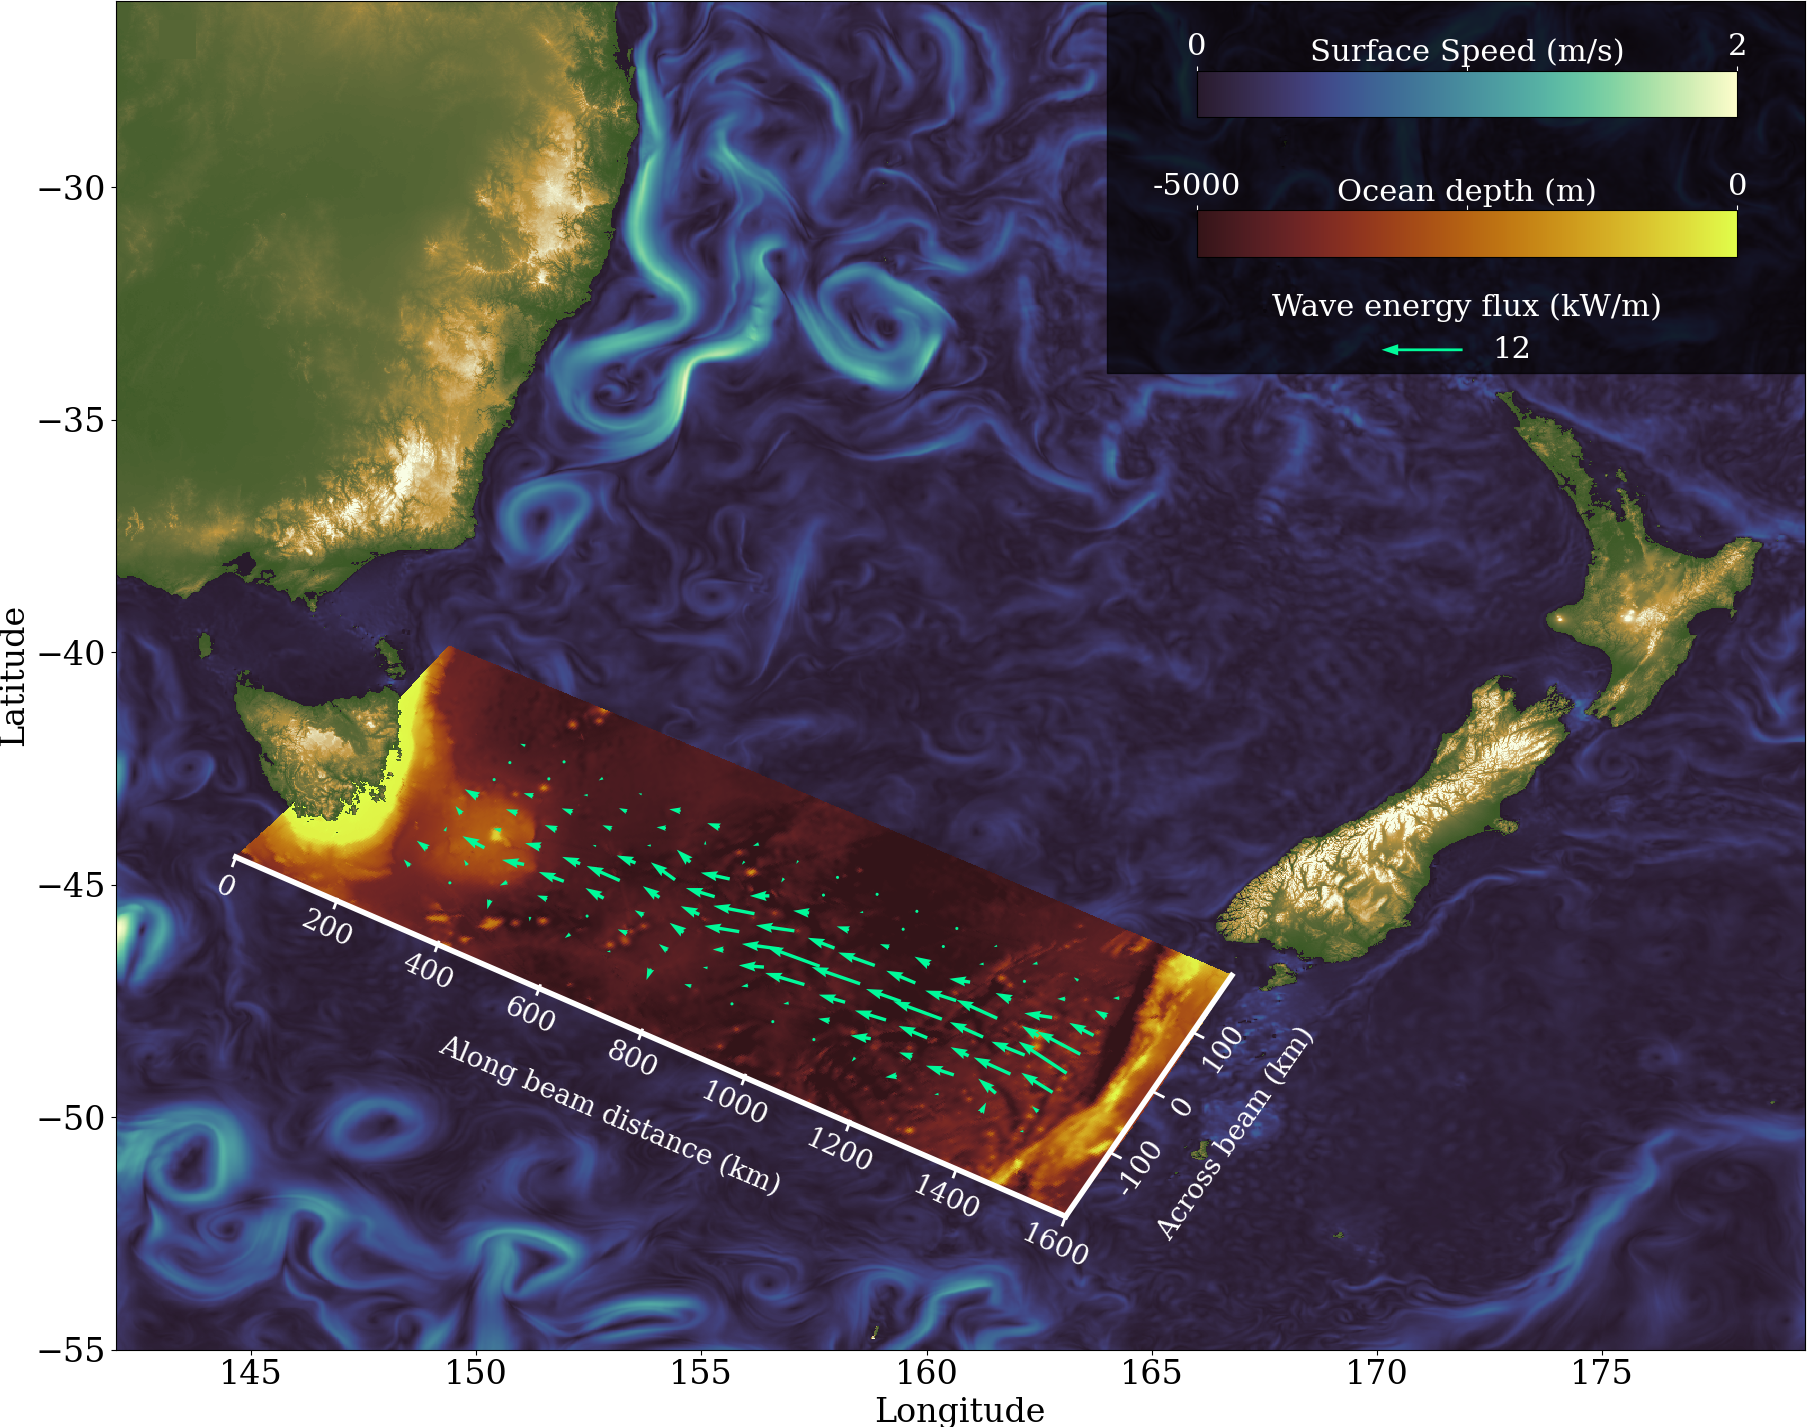
Here we have the surface speed of the ocean in blue, showing the East Australian current, and an eddy just about to pinch off near Sydney. In the inset domain, we have the analysis region. This shows the topography, most notably an underwater mountain range called Macquarie Ridge just south of New Zealand. This is generating a powerful internal wave, whose energy flux (a measure of energy transfer) shown with green arrows point towards Tasmania like a laser beam.
This energy flux that I calculated from my model output matched observations really well, and we were able to study how the beam behaves when the model is run at coarser resolutions.
These waves are big: they start out with wavelengths of about 200km, but can’t break and release their energy until they’ve been downscaled. Subsequent figures in the paper break down this energy flux into components with different scales, to help us understand which processes cause the waves to scatter to smaller scales. An important process is the interaction with the Tasmanian continental slope to the west.
It turns out that at least a 2km horizontal resolution is required to match observations here, meaning that most models used today wouldn’t be getting this energy pathway right. Consequently, these models would be slightly biased in the rate of vertical mixing near Tasmania, in turn affecting how heat, nutrients and carbon are transferred from the deep to the surface.