Entry by Alex Harrison
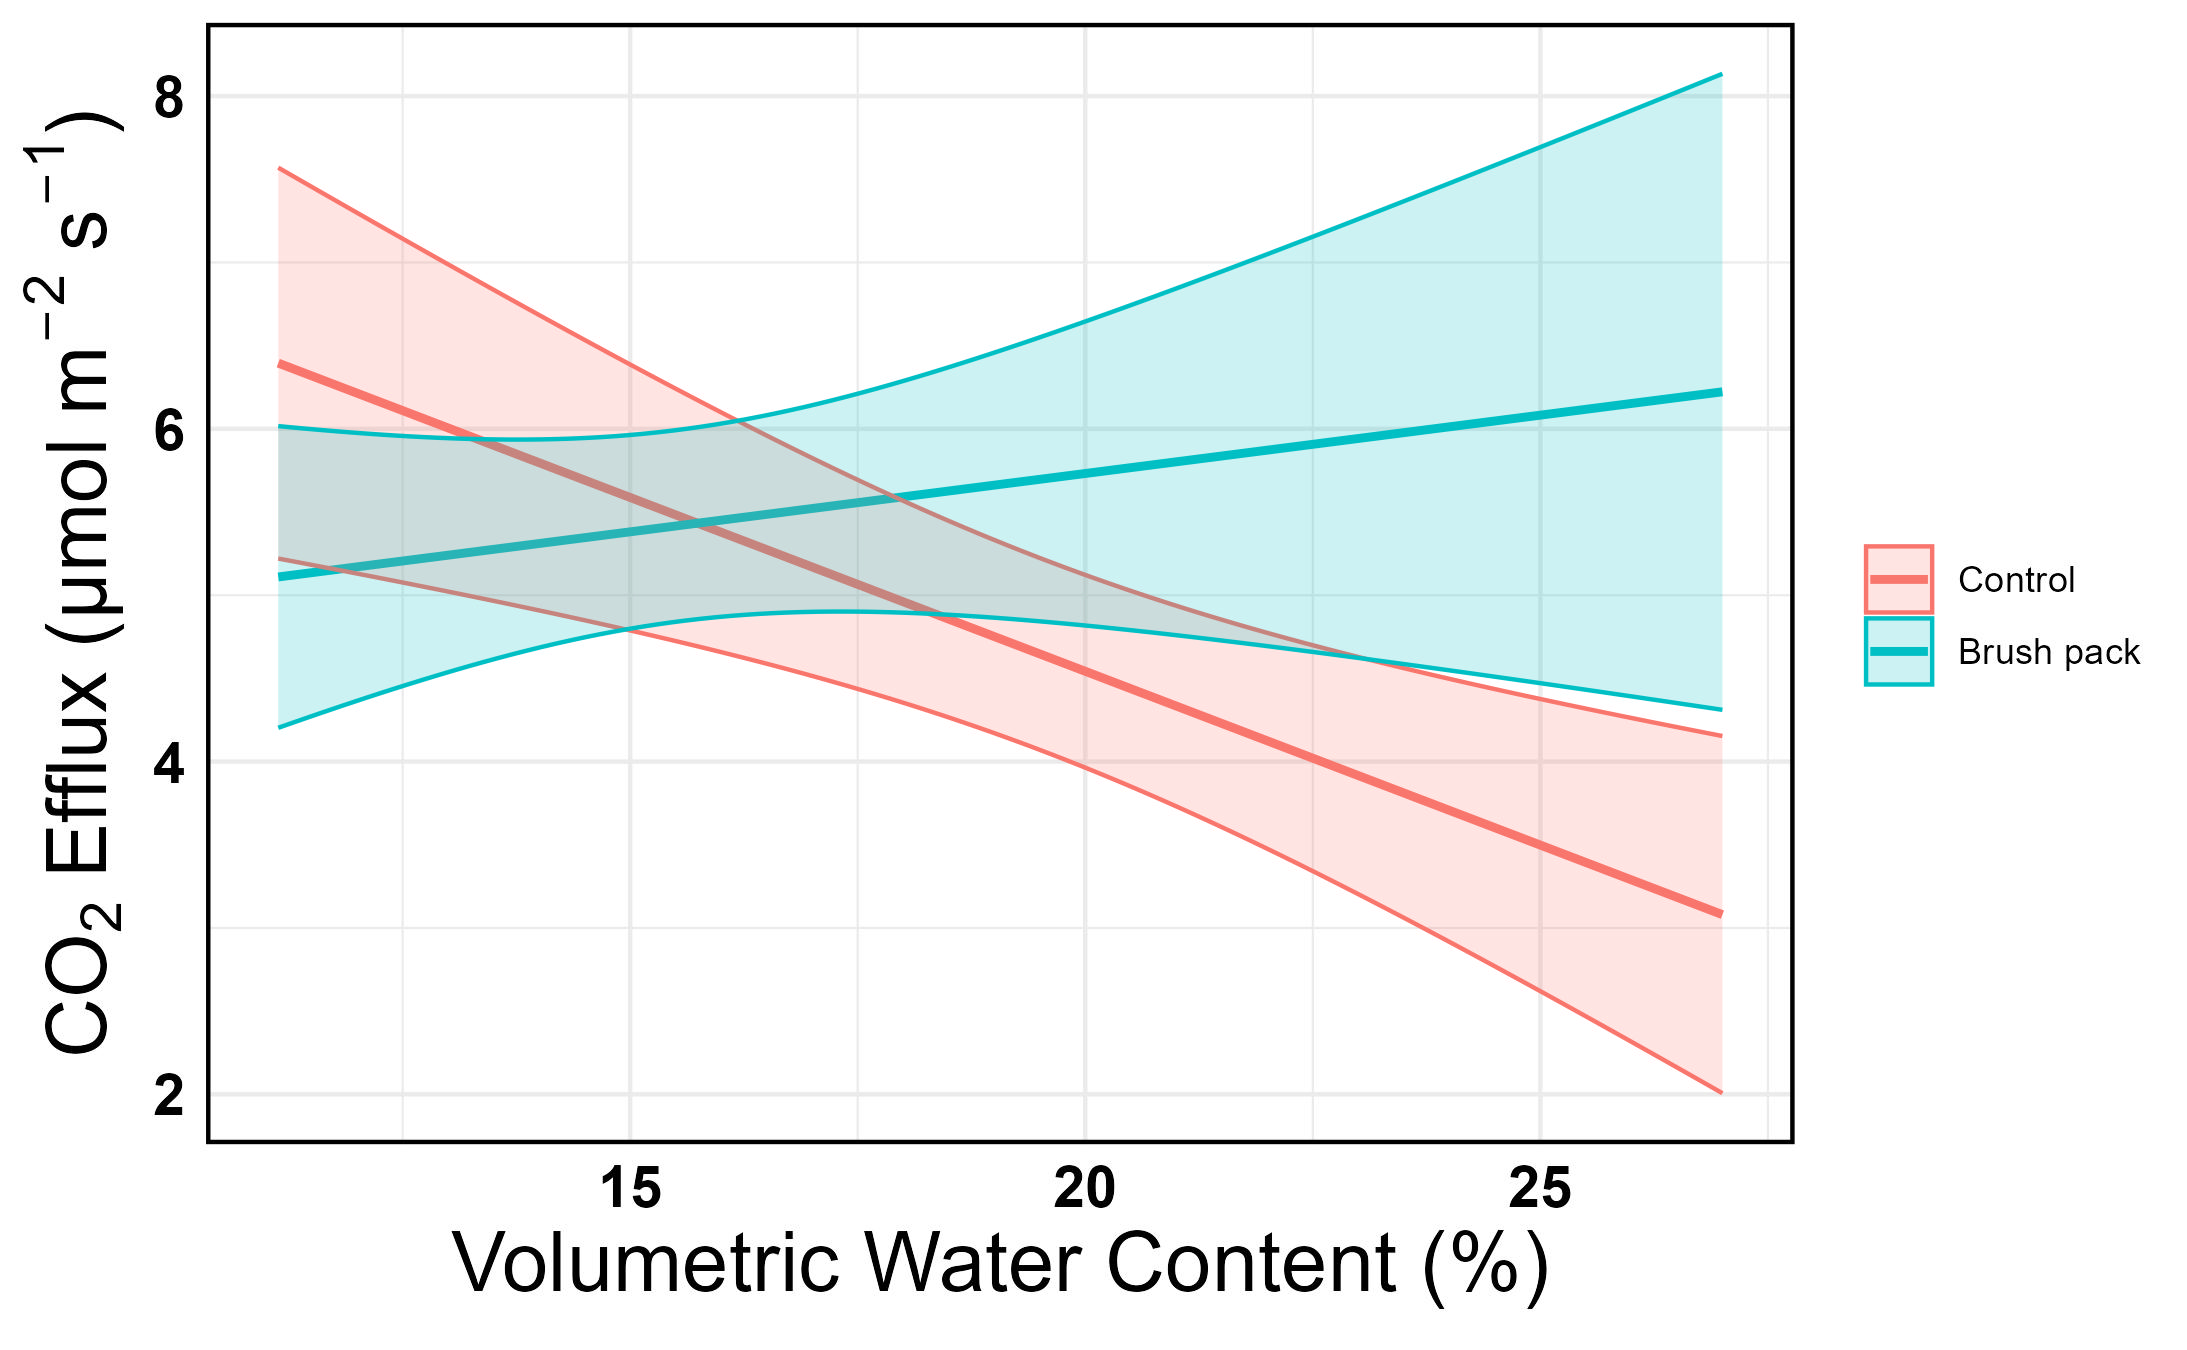
The graph shows the predicted soil CO2 efflux (or soil respiration rate) against the moisture content of the soil. It compares two treatments: brush packs and a control (no treatment). The predictions are derived from a linear mixed-effects model with treatment, moisture, and the interaction between treatment and moisture (VWC) as fixed effects, with site measured as a random effect to account for spatial variation in respiration. Each prediction is plotted with 95% confidence intervals (shaded regions).
The cool part is the main effects of both the brush pack treatment and moisture were negative. So, you might expect to see brush packs with high moisture levels having relatively lower efflux values. Nope! As you can see in the graph this is not the case! There is this huge interaction effect between moisture and the brush pack treatment (see below table of fixed effects). It’s so huge that it overpowers the negative main effect of moisture and leads to brush pack treated sites having higher efflux than the control at higher moisture levels. If you interpret this for management, it could mean that brush packs improve CO2 efflux in environments with higher moisture levels. However, as you can see in the graph the 95% confidence intervals are mostly overlapping so there isn’t really a significant difference in efflux between treatments, at least over the range of moisture levels I sampled.
Another cool feature of this graph is the confidence interval for the brush pack treatment noticeably widens above 22.5% VWC. While the moisture values sampled across both treatments ranged from 11-27% (x-axis range), no data sampled from the brush pack sites had moisture levels above 22.5%. The model has tried to account for this uncertainty by widening the confidence interval.
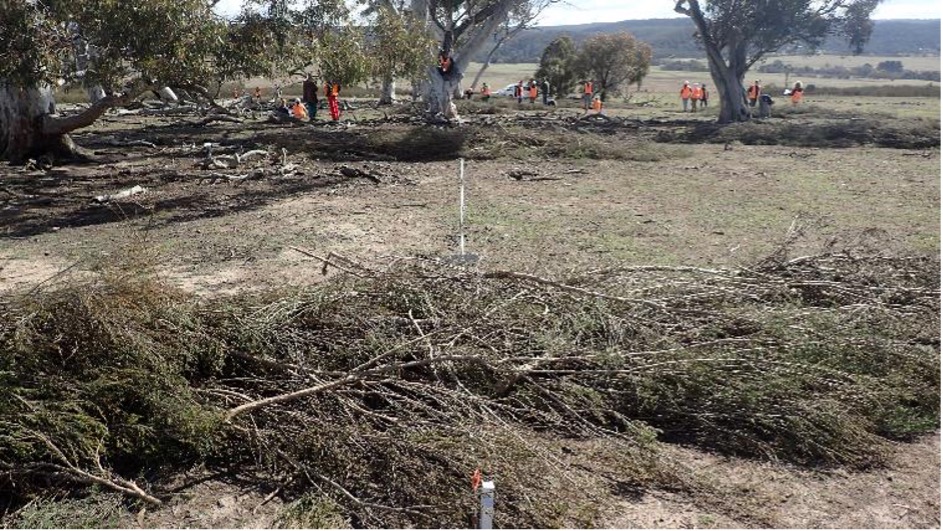
See photo of what a brush pack looks like below!
| Fixed effects: | Estimate | Std. Error | df | Estimate CI 2.5 % | Estimate CI 97.5% | p-value |
|---|---|---|---|---|---|---|
| (Intercept) | 8.72 | 1.25 | 21.25 | 6.34 | 11.15 | <0.001 *** |
| TreatmentB | -4.39 | 1.80 | 26.66 | -7.89 | -1.01 | 0.02 * |
| Moisture | -0.21 | 0.06 | 21.27 | -0.33 | -0.09 | 0.003 ** |
| TreatmentB: Moisture | 0.28 | 0.10 | 28.96 | 0.09 | 0.48 | 0.01 * |